Lesson 2 of 12 · 3 min · Valuation
The P/E ratio
How many years of profit the price buys you.
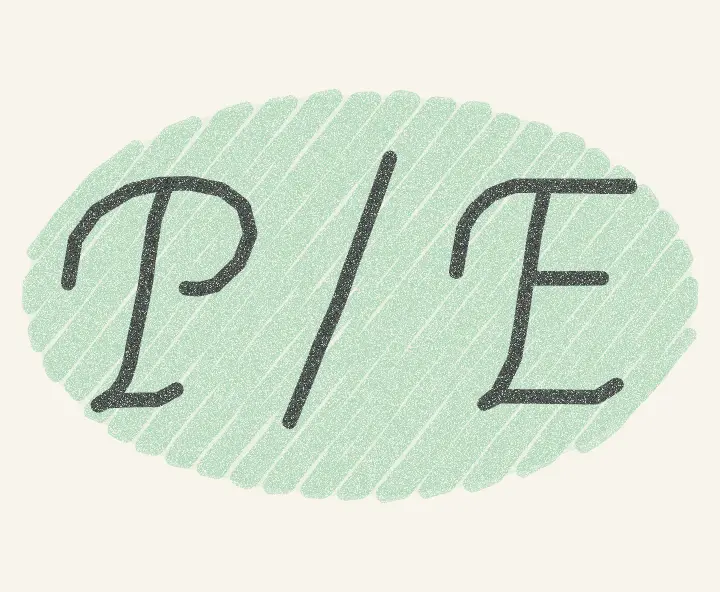
The price to earnings ratio, or P/E, divides the share price by the profit per share. It is the most quoted number in investing.
Lemon Co made a profit of $1.5 million last year. Spread over 1 million shares, that is $1.50 per share. At $30 a share, the P/E is 20.
One way to picture it: if profits stayed exactly the same, it would take 20 years of Lemon Co’s earnings to pay back what you paid.
Turn it upside down and you get the earnings yield: $1.50 divided by $30 is 5%. That makes it easy to compare with the interest on savings or bonds.
Lower means cheaper: you pay less for each dollar of profit. But a high P/E is not bad on its own. It usually means buyers expect profits to grow. A low one can be a bargain, or a business in trouble.
What counts as high? Since 1871, the US market has averaged a P/E of about 16. In recent years it has mostly sat above 20. Fast growing industries usually carry higher P/Es, so compare with rivals too.
Watch out for odd years. A one off gain or loss makes the profit jump, and the P/E with it. Look at several years before you trust it.
Quick question
Stock A has a P/E of 10. Stock B has a P/E of 30. What can you say?
- A is the better buy
- Buyers expect more profit growth from B
- B earns more money
Show the answer
Buyers expect more profit growth from B
A higher P/E means people pay more for each dollar of today’s profit, usually because they expect it to grow. Whether that hope is right is the real question.
Keep this one
P/E: years of today's profit you pay for.
Where this comes from
The standard definition: share price divided by earnings per share. The long run average of about 16 uses Robert Shiller’s S&P data since 1871 (trailing twelve month earnings). Lemon Co is invented for teaching.