Lesson 6 of 7 · 3 min · Risk
The price of admission
Stocks grow over time. They also fall hard, now and then.
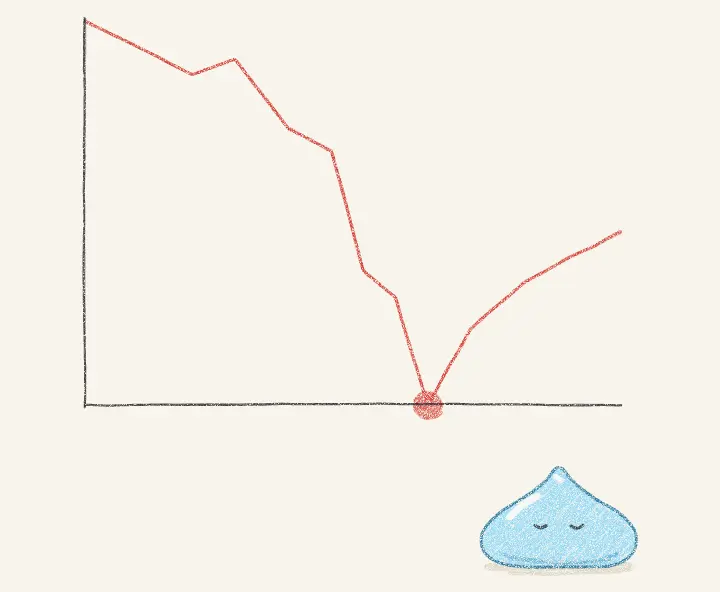
Over long stretches, stocks have earned more than bonds or cash. That extra return is not free. You pay for it by sitting through falls.
From October 2007 to March 2009, the S&P 500 fell about 57%. $10,000 became about $4,300. It took until 2013 to get back to the old high.
In early 2020 it fell about 34% in just over a month. Five months later it was back at the old high. Nobody knew that while it was falling.
The worst fall came after 1929. US stocks lost around 86% by 1932. That was the extreme. Drops of a third or more also came in 1937, 1973, 1987 and 2000, on top of the two above.
The real risk is selling near the bottom. The fall only becomes a permanent loss if you sell. So only invest money you will not need for years.
Quick question
You have money for a house you want to buy next year. Where does it belong?
- In stocks, for the higher return
- Somewhere safe, like savings
- Half in each
Show the answer
Somewhere safe, like savings
A 30% or 50% fall can happen in any single year. Money you need soon should not have to wait for a recovery.
Keep this one
Falls are the fee. Don’t sell into them.
Where this comes from
S&P 500 closing prices: 1,565 on 9 October 2007, 677 on 9 March 2009; 3,386 on 19 February 2020, 2,237 on 23 March 2020. The 1929 to 1932 fall is for US large company stocks. The charts are simplified. The other example uses 7% a year, which is 15 times over 40 years.